
When analyzing your website, you want the full story of how visitors are engaging with your site. You want to know not only how many visitors you get, but where they’re coming from, how long they’re spending on your site, how soon they’re leaving, and much more.
To find the answers to these questions, you need to track website engagement metrics. In this guide, we’ll introduce this key concept, discuss the top metrics to watch for while running a successful website in 2022, and hear from actual website owners about what metrics they're prioritizing for the upcoming year.
→ Download Now: SEO Starter Pack [Free Kit]
What are website engagement metrics?
Website engagement metrics measure how much your website visitors are interacting with your website and online brand. These metrics can tell you where your visitors tend to go on your website, for how long, how often, and how they arrived on your website.
Ultimately, the goal of your site is to turn visitors into leads and leads into customers, but the journey there can be difficult to understand without hard data. Fortunately, website engagement metrics are here to clear things up. With the help of an analytics tool like HubSpot or Google Analytics, you can leverage engagement metrics to see where your site is capturing attention, and where you can make some tweaks to increase engagement.
You might find that a page is formatted poorly, or that some of your content doesn’t match user intent, or that your CTA’s ate underperforming. On the flip side, your engagement metrics may reveal that your marketing and content strategies are crushing it on every level. Either way, you won’t know until you lift the hood and see the data — let’s do that now.
Website Engagement Metrics to Watch
- Page Views
- Average Time on Page
- Average Session Duration
- Pages per Session
- Bounce Rate
- Traffic Sources
- New Visitor Sessions
- Repeat and New Visitors
- Conversion Rate
- Exit Rate and Top Exit Pages
- Revenue Attribution
- Event Tracking
With so many website-relevant metrics available, it’s easy to become overwhelmed, especially if you’re just beginning. So, here are just 12 simple but important engagement metrics to inform your web strategy. For each one, we’ve included the process for analyzing and tracking it in HubSpot and tips for improving your results.
1. Page Views
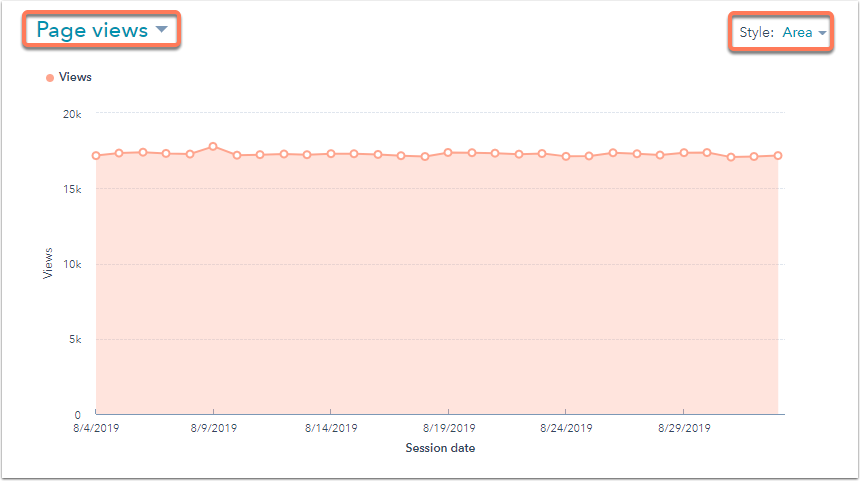
Page views measure the number of times a page on your website is seen by a visitor. Any time a page on your website is loaded in a browser, this counts as one page view. So, if a visitor loads a page, then reloads the same page, this would count as two page views.
How to Analyze Page Views
A steady upward trend of page views generally indicates successful SEO, marketing, and brand awareness efforts. Still, while page views can tell you generally how popular your site’s pages are and how much traffic your site is receiving as a whole, they’re not useful without other metrics to give more context.
High page views could result from a thriving ad campaign or SEO initiative, but it could indicate something negative. For example, users might be frequently reloading your pages — a sign of performance issues — or wandering around your site without a clear goal — a sign of potentially poor navigation and/or structure.
Conversely, a lower page view count isn’t necessarily bad. If you want users to follow a specific path, fewer page views could mean they’re converting efficiently without loading many pages.
Context is key when looking at raw page views. That’s why, while a good place to start, page views shouldn’t be the only metric you take into account.
How to Track Page Views
1. Log into your HubSpot Account.
2. Navigate to Reports > Analytics Tools.
3. Click Traffic Analytics.
4. Select the Pages tab.
5. Select Page Views from the dropdown menu in the upper left of the chart to see how it's changed over time.
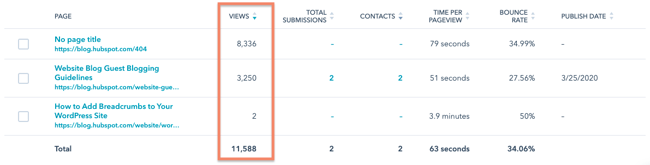
6. Scroll down to the table below the chart and find the column labelled Views. The total will be listed at the bottom in the row labelled Total.
How to Improve Page Views
You can improve page views by promoting related content in the sidebar, adding internal links, and writing eye-catching headlines, among other strategies.
2. Average Time on Page
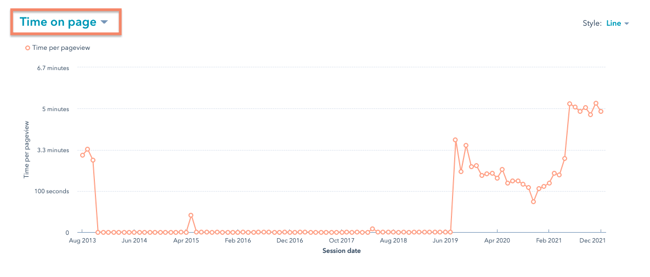
Average time on page measures how long visitors tend to spend on a web page. Time on page can be an excellent indicator of how engaging and effective your content is — the longer you hold visitors on a page, the better. Longer time on page also suggests that you’re attracting quality visitors who value your information, while shorter times generally indicate less interest.
How to Analyze Average Time on Page
In a survey by Databox, 45% of respondents said that average time on page on their website is between 3-5 minutes. While that's a good benchmark, meeting it doesn't necessarily mean your average time on page is optimal.
Like page views, average time on page is also contextual. For example, you ideally want visitors spending more time on your product pages and blog posts. To increase time spent on these pages, you can add more relevant content to them, make your content easy to read and understand, and work to capture your intended audience through organic search and other channels.
On landing pages, however, higher time on page could hint that there are barriers to conversion. For instance, content and CTAs could be confusing. See our guide to landing page design for pointers on improving this part of your site.
How to Track Average Time on Page
To track average time on page for your website overall, follow the steps below:
1. Log into your HubSpot Account.
2. Navigate to Reports > Analytics Tools.
3. Click Traffic Analytics.
4. Select the Pages tab.
5. Select Time on page from the dropdown menu in the upper left of the chart to see how it's changed over time.
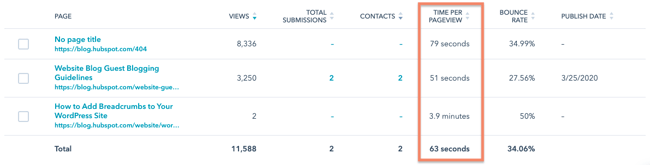
6. Scroll down to the table below the chart and find the column labelled Time Per Pageview. The average will be listed at the bottom in the row labelled Total.
To track average time on page for individual page or post, follow the steps below:
1. Log into your HubSpot Account.
2. Navigate to Marketing > Website > Website Pages or Blog.
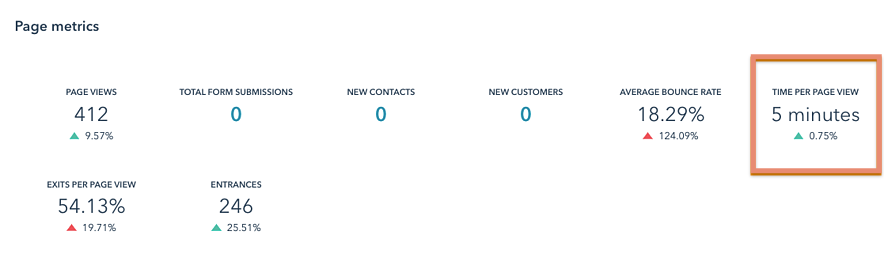
3. Click on a post page or post.
4. Scroll to the box labelled Page metrics to see the Time Per Page View.
How to Improve Average Time on Page
Improving average time on page is all about giving visitors a reason to stay longer. Meeting search intent, embedding multimedia content, and optimizing page load times can help persuade readers.
3. Average Session Duration
A session is a group of interactions with your site within a set time period, typically one to two hours. A session can be roughly equated to one person’s visit to your website, whether that’s viewing a single page or exploring more of your site.
How to Analyze Average Session Duration
Similar to average time on page, average session duration measures how long users typically spend time on your entire website. It’s calculated by dividing the number of sessions over a set time period by the total amount of time all users have spent on your site in that period. Since those who spend more time on your website are more likely to convert, you want to focus on increasing this metric.
Session durations can provide a clearer picture of your audience engagement, since a session describes one’s complete experience on your website, instead of a page-by-page analysis.
How to Track Average Session Duration
1. Log into your HubSpot Account.
2. Navigate to Reports > Analytics Tools.
3. Click Traffic Analytics.
4. Select the Sources, Topic clusters, UTM Parameters, Device types, Countries, or Browsers tab.
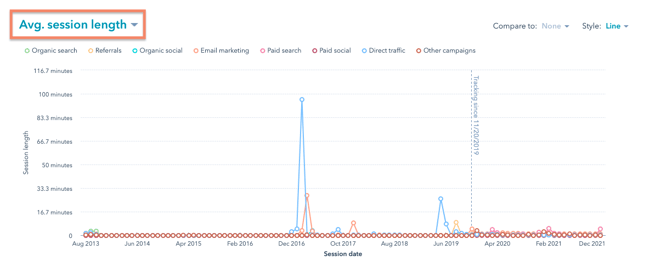
5. Select Avg. session length from the dropdown menu in the upper left of the chart to see how it's changed over time.
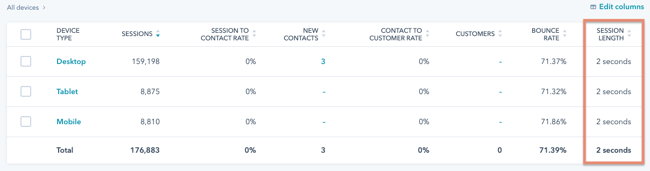
6. Scroll down to the table below the chart and find the column labelled Session Length. The average will be listed at the bottom in the row labelled Total.
How to Improve Average Session Duration
Improving average session duration is similar to improving average time on page. The key difference is that your aim is to optimize your entire website to get visitors to stay longer, not just individual pages. Improving your navigation, content, and visual design in general can promote longer sessions.
4. Pages per Session
Another telling metric related to your user sessions is the number of pages visited per session. While your average session duration might be high, how are visitors using this time? Do they stick to one or two pages, or do they explore further? Pages per Session can answer these questions.
How to Analyze Pages per Session
More pages loaded per session is usually a good thing, since this shows that visitors are interested in exploring your content, and which ones are most likely to convert. You can further dig into this metric to follow visitors’ conversion paths — where they land on your site, and what pages lead them to the exit page (more on that later).
However, lower Pages per Session isn’t always a bad sign. For instance, blogs with lengthy articles should expect fewer pages loaded per session, so session duration and time on page might be more useful to consider in this case.
How to Track Pages Per Session
1. Log into your HubSpot Account.
2. Navigate to Reports > Analytics Tools.
3. Click Traffic Analytics.
4. Select the Sources, Topic clusters, UTM Parameters, Device types, Countries, or Browsers tab.
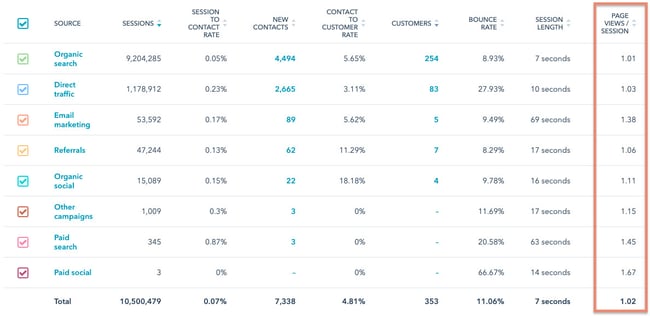
5. Select Page views / sessions from the dropdown menu in the upper left of the chart to see how it's changed over time.
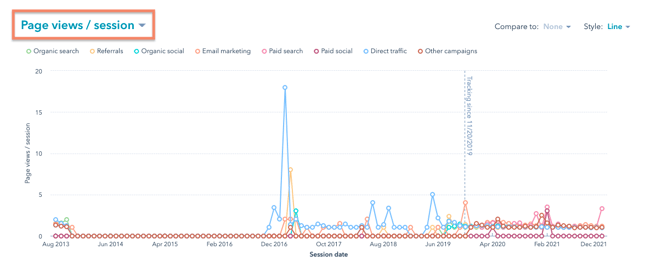
6. Scroll down to the table below the chart and find the column labelled Page Views / Sessions. The average will be listed at the bottom in the row labelled Total.
How to Improve Pages Per Session
If your Pages per Session count is low, incorporate prompts to explore your website — offers, related posts recommendations, and inline links to product pages are a few items you can place on your highly trafficked pages to boost this metric.
5. Bounce Rate
Bounce rate is the percentage of visitors who load one page on your website, then leave without interacting with the page or visiting any other pages — they “bounce” off of your website and go elsewhere.
How to Analyze Bounce Rate
A high bounce rate means your website is performing poorly, and there could be several reasons for this: Your navigation may be confusing, your content doesn’t match the visitors’ intent, the CTAs are not obvious (or way too obvious), your site simply doesn’t offer enough content-wise or design-wise to hold attention, or something may be broken on your site.
In a survey by Top Design Firms, 42% of consumers said they will leave a website because of poor functionality.
If your site is experiencing a high bounce rate, hone in on the individual pages with the highest bounce rates, and compare them to those with lower bounce rates. This is a good way to see what’s working with your visitors, and what can be improved or removed.
How to Track Bounce Rate
1. Log into your HubSpot Account.
2. Navigate to Reports > Analytics Tools.
3. Click Traffic Analytics.
4. Select the Sources, Topic clusters, UTM Parameters, Device types, Countries, or Browsers tab.
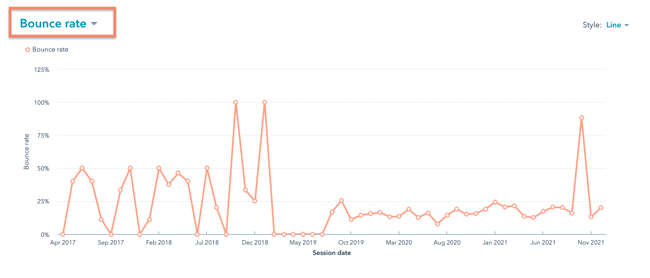
5. Select Bounce rate from the dropdown menu in the upper left of the chart to see how it's changed over time.
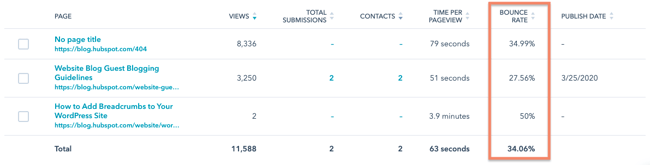
6. Scroll down to the table below the chart and find the column labelled Bounce Rate. The average will be listed at the bottom in the row labelled Total.
How to Improve Bounce Rate
Reducing bounce rate depends on analyzing what is causing visitors to bounce in the first place. Once you analyze that, next steps might be setting external links to open in new tabs, improving page load time, or optimizing meta descriptions.
For a more in-depth look at best practices, check out our guide to reducing bounce rate for any platform or for WordPress specifically.
6. Traffic Sources
Where are your visitors coming from? It’s a question that all website owners should have top-of-mind. While the amount and names of traffic sources vary by analytics tool, some common ones are:
- Organic search: These visitors arrived at your website through non-paid results on the search engine results page (SERP). Most likely, they found your site through Google Search.
- Paid search: These visitors arrived by clicking ads on the SERP.
- Referrals: Referral traffic comes to your website via links on an external website. Many analytics tools exclude search engines from this source (as those would be considered organic search traffic), and some tools also segment referral sources further into categories like social media.
- Email: This traffic comes from links included in your emails.
- Direct: These users arrive at your website via a browser bookmark or by entering the URL directly into the browser bar.
How to Analyze Traffic Sources
There’s no one perfect distribution of traffic sources, as every business has a different strategy to draw visitors. It’s useful to see how your sources change over time, but pay most attention to organic search traffic — this is likely your largest traffic source, and improving it can also boost your other sources like email and referral.
Also, consider which traffic sources convert best. According to research by FirstPageSage, organic and email traffic sources have the highest average conversion rates: organic has a 2.6% conversion rate and email has a 2.4% for B2B businesses. If this is true of your business as well, then focus on increasing organic and email traffic.
Phil Vallender, Director at Blend Marketing and HubSpot Elite partner, notes how important traffic sources are when paired with other metrics, like conversion rates. He says, "In 2022, the most important website metrics to me are going to be the ones that align to the core purpose of our website: to generate demand by turning interest into opportunity. Therefore I will always look at sessions, traffic sources, and conversion rates before anything else. When working to improve any of these metrics, many more engagement metrics become relevant and interesting, as they reveal where and how I can improve the customer experience."
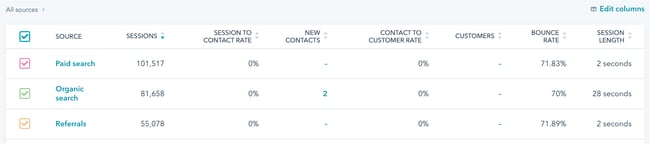
How to Track Traffic Sources
1. Log into your HubSpot Account.
2. Navigate to Reports > Analytics Tools.
3. Click Traffic Analytics.
4. Select the Sources tab.
5. Select different metrics from the dropdown menu in the upper left of the chart to compare multiple sources' data.
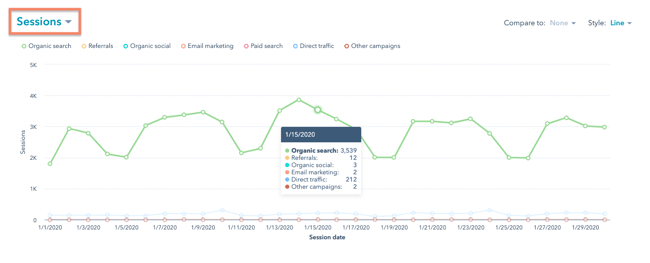
6. Scroll down to the table below the chart to see the raw metrics based on each source.
How to Improve Traffic Sources
Improving traffic sources depends on which sources you want to improve. If you want to improve direct traffic, check that any redirects are properly set up. If you want to improve email traffic, consider A/B testing.
For more best practices, check out our guide to diagnosing and fixing traffic drops.
7. New Visitor Sessions
New visitor sessions measures the number of new unique individuals who initiate at least one session on your site during a specific period of time. If a user initiates multiple sessions, they’re still counted as the same visitor.
It's important to note that this metric is different from unique visitors, which is not always reliable. For example, a user may clear their cookies, use a different browser, or block cookies before viewing your site. In that case, all these page views would be tracked and attributed to multiple unique visitors instead of the same one visitor. That's why some analytics tools, like HubSpot, do not track unique visitors — but track new visitor sessions instead.
How to Analyze New Visitor Sessions
Like page views, look for a consistent upward trend in your new visitor sessions and how this number changes after design changes, SEO updates, and marketing plays. A stagnant or decreasing number of visitors is a sign that you might need to reassess your marketing and content strategy.
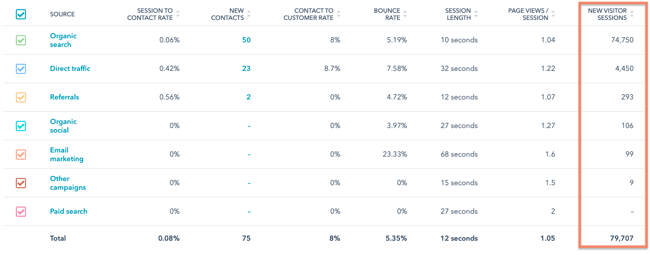
How to Track New Visitor Sessions
1. Log into your HubSpot Account.
2. Navigate to Reports > Analytics Tools.
3. Click Traffic Analytics.
4. Select the Sources, Topic clusters, UTM Parameters, Device types, Countries, or Browsers tab.
5. Select New visitor sessions from the dropdown menu in the upper left of the chart to see how it's changed over time.
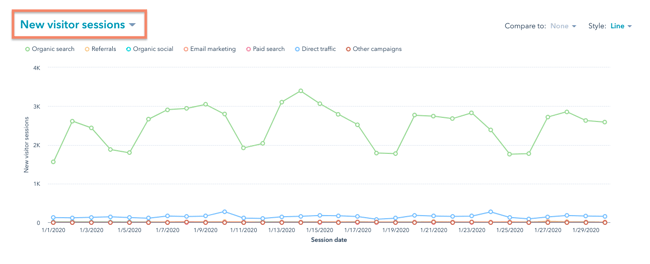
6. Scroll down to the table below the chart and find the column labelled New Visitor Sessions. The total will be listed at the bottom in the row labelled Total.
How to Improve New Visitor Sessions
Increasing new visitor sessions may require changes to your design, SEO, or marketing strategy. Maybe you need to generate more backlinks, promote highly targeted content on social media, or work with influencers to attract new visitor to your site.
8. Repeat and New Visitors
A new visitor is someone who is visiting your website for the first time, while a repeat (or returning) visitor has initiated a session previously.
How to Analyze Repeat and New Visitors
Comparing your new and repeat visitors gives you a sense of how “sticky” your website is — in other words, do first-time visitors find enough value that they want to come back again?
It can be tricky to maintain an ideal ratio of repeat to new visitors. You want to balance a flow of net new visitors at the top of the funnel with a steady audience of returning users. Aim for a repeat visitor rate of 10% (meaning one in 10 visitors is a repeat visitor) to 30%. Anything lower than 10% probably means your site lacks enough value to retain new visitors, and anything higher than 30% likely means you’re not bringing in enough fresh traffic to grow your base.
How to Track Repeat and New Visitors
1. Log into your HubSpot Account.
2. Navigate to Reports > Analytics Tools.
3. Click Traffic Analytics.
4. Select the Sources, Topic clusters, UTM Parameters, Device types, Countries, or Browsers tab.
5. Select New session % from the dropdown menu in the upper left of the chart to see how it's changed over time.
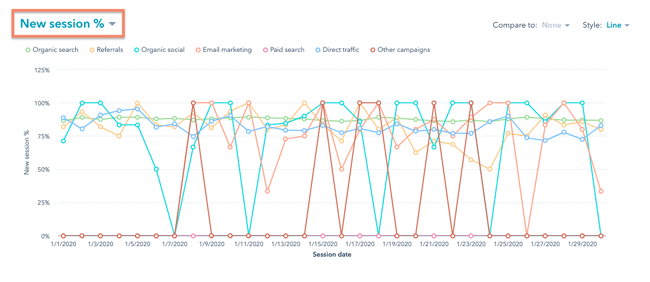
6. Scroll down to the table below the chart and find the column labelled New Session %. The average will be listed at the bottom in the row labelled Total.

How to Improve Ratio of Repeat to New Visitors
To improve your ratio of repeat and new visitors, you can focus on organic search optimization and campaigns for new visitors.
Suzanne Bull, Director of Content and Communications at Cambridge Education Group (Digital), said, "We’ve looked at improving pages with a high number of new visitors. By providing better links to more Top-of-the-Funnel content on these pages, we’ve seen an improvement in conversion rates. Visitors can take a clearer journey through content they’ll value, building trust and keeping them engaged to the point that they enquire."
To increase repeat users, turn your attention to email and the overall quality of your site — this gives a more positive first impression and encourages return visits.
9. Conversion Rate
At last, the goal of your marketing efforts — conversion rate (CVR) is the percentage of visitors who complete a desired action on your website. This action could be filling out a form, downloading a content offer, signing up for a trial or a demo, or purchasing a product. The higher the CVR, the better.
How to Analyze Conversion Rate
Since you’ll probably have multiple points of conversion, you can compare CVRs across different CTAs and landing pages.
For underperforming CTAs, you may need to tailor the offer or placement to better align with the surrounding content. The conversion may also be too difficult or confusing, in which case you should remove friction for the visitor.
You can also break down conversion rate into different subtypes, including visitor-to-lead CVR, lead-to-customer CVR, and visitor-to-customer CVR — this detailed information provides more insight into where your funnel excels or needs improvement.
How to Track Conversion Rate
There are multiple ways to track conversion rates in HubSpot. Let's outline them all below.
1. Log into your HubSpot Account.
2. Navigate to Reports > Analytics Tools.
3. Click Traffic Analytics.
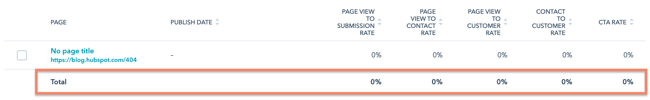
4. Select the Pages tab.
5. Select Page view to submission, contact, or customer rate, Contact to customer rate, or CTA rate from the dropdown menu in the upper left of the chart to see how it's changed over time.
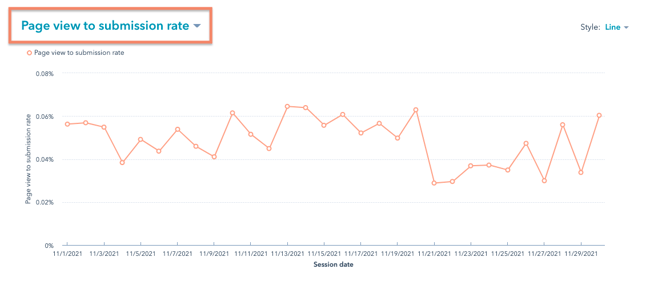
6. Scroll down to the table below the chart to see each of these metrics based on each page. The averages will be listed at the bottom in the row labelled Total.
How to Improve Conversion Rate
There are many possibilities for a low CVR, which means there are dozens of ways to improve it.
Bull, for example, said that Cambridge Education Group (Digital) is focused on improving their visitor-to-lead CVR." With HubSpot analytics we’ve been able to identify pages where views are high but conversion is low and made significant improvements to rates by improving CTAs on the page. This has encompassed looking at the CTA design, position on page, and copy."
Wellers Partner Chris Thompson says his company is also focusing on CVR in 2022 since they focused heavily on SEO this year and are seeing significant traffic gains. “Our attention now turns to what we do with all those visitors? So, while we’ll continue with our SEO efforts in 2022, more focus will shift to our conversion rate, specifically our visitor-to-lead conversion rates as well as our visitor-to-client conversions. With a goal of doubling the number of qualified leads per month by the end of 2022, we are going to bring on new personnel to help write conversion-based content related to our top-performing posts, and further design work around our calls to action.”
For a better understanding of all the ways you can improve CVR on your site, check out our guide to conversion rate optimization.
10. Exit Rate and Top Exit Pages
You can try to prolong your visitors’ sessions as much as possible, but everyone has to leave your site eventually. Exit pages are the last pages that visitors see before exiting your site.
How to Analyze Exit Rate and Top Exit Pages
While every page is an exit page to an extent, you’ll want to pay attention to those with the highest exit rates. For a given page, exit rate is the percentage of page views that were the last of the session.
The goal is to make your top exit pages the ones you expect, such as thank you pages and download pages. A high exit rate is a problem on pages where you’re trying to hold interest or convert.
Compare your top exit pages to your low exit pages for discrepancies — perhaps you’ll find a confusing, slow, or broken page, or maybe a page is a dead-end due to a lack of a CTA or link elsewhere. Whatever the reason, the goal is to keep sessions as long as possible, as this ups the chance of a conversion.
How to Track Exit Rate
1. Log into your HubSpot Account.
2. Navigate to Reports > Analytics Tools.
3. Click Traffic Analytics.
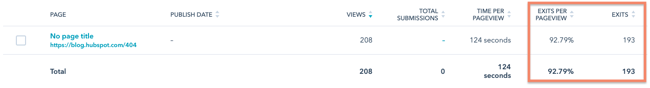
4. Select the Pages tab.
5. Select Exits and Exit rate from the dropdown menu in the upper left of the chart to see how these respective metrics changed over time.
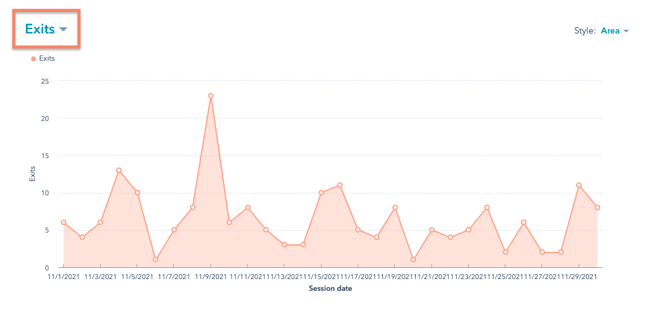
6. Scroll down to the table below the chart and find the column labelled Exits and Exits Per Pageview. The total will be listed at the bottom in the row labelled Total.
How to Improve Exit Rate
Adding exit intent popups, using a sticky widget in the sidebar, and optimizing your internal linking strategy are just a few ways you might improve the the exit rate on your site.
11. Revenue Attribution
Revenue attribution is a great complement to conversion tracking. While the latter tracks individual actions taken by visitors on a website, like clicking on a CTA, revenue attribution follows visitors throughout their journey, from when they first land on a website to the point they purchase a product or service. It tracks all marketing (and usually sales) activities to the point at which they generate revenue, and how much they generate.
How to Analyze Revenue Attribution
Since a customer can have hundreds of interactions with a brand before ever making a purchase, understanding the customer journey is difficult. That's where attribution modeling comes in. Attribution modeling enables you to measure what channels and assets are creating sales opportunities. This will provide hard evidence that your marketing team and organization as a whole needs to invest in and amplify similar resources in the future.
Christina Kay, Vice President of Marketing at ResellerRatings, also says that this type of attribution can help you think of the relationship among common website metrics and to your bottom line: “Tracking and measuring revenue in particular will help you think of your funnel and give a full view of your website’s goals. That’s because using revenue as an engagement metric combines a lot of the metrics mentioned above." For example, a dip in revenue may point to decreasing order value as a result of increased bounce rate and abandonment rate on a web page where lots of widgets, images, and videos have been added.
How to Track Revenue Attribution
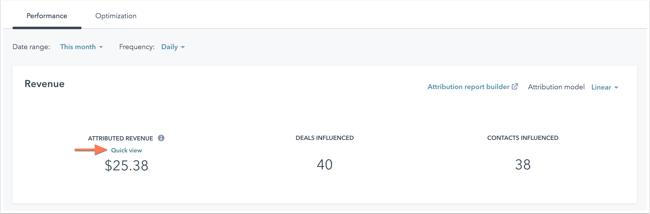
To track attributed revenue for all asset types and channels on your site, follow the steps below:
1. Log into your HubSpot Account.
2. Navigate to Reports > Reports.
3. Click Create Custom Report.
4. Select Attribution > Revenue.
To track attributed revenue for an individual page or post, follow the steps below:
1. Log into your HubSpot Account.
2. Navigate to Marketing > >Website > Website Pagesor Blog or Marketing > Landing Pages.
3. Click on a post page or post.
4. Scroll to the box labelled Page metrics to see the Attributed Revenue.
How to Improve Revenue Attribution
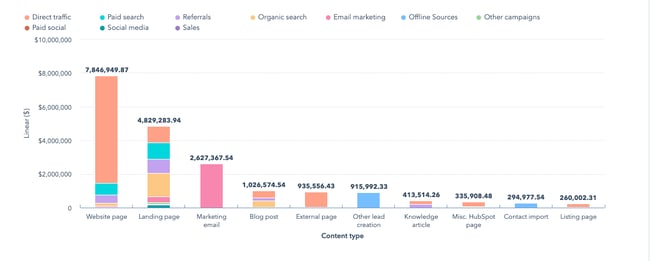
Attribution reports help show which pages and/or marketing channels drive the most conversions, which can help you optimize your budget and efforts. To increase generated revenue, you can create more content related to topics or formats that have the highest attributed revenue, invest in channels with the highest attributed revenue, or promote and optimize the web pages that are viewed the most before someone becomes a customer.
12. Event Tracking
While there are a set of engagement metrics every website would benefit from tracking, there’s no “one” most important metric. What’s most important hinges on the unique actions you want visitors to take on your site.
That’s why event tracking is so important. Events are actions that users take on your site, like downloading a resource, clicking a link, submitting a form, and playing a video.
How to Analyze Event Tracking
Event tracking can help you discover what people are interested in or ignoring on your site, where they're getting stuck or abandoning the customer journey, and what they want or care about that's persuading them to convert.
For example, you may identify a page where a large percentage of visitors are abandoning your site. Analyzing that page may reveal a broken form or another reason that's causing visitors to drop out of the funnel, which you can fix in order to increase conversions.
Matthew Wood, Head of Digital at Karman Digital and a HubSpot Diamond Partner, stressed the importance of this metric. He said, “When we look at both new websites and the performance of our current clients’ websites one of our main focuses is behavior flow and events tracking. We want to know how are the users moving around the website, what are they clicking on, and where are they dropping off? Since we have spent time and money getting the user to the website, keeping them on it and getting them to the right pages is just as important. Our focus now and going into 2022 will be completely around tracking events and user behavior so that we can make informed decisions on website design and, more importantly, CRO.”
How to Track Events
1. Log into your HubSpot Account.
2. Navigate to Reports > Analytics Tools.
3. Click Custom Behavioral Events.
4. Click the Analyze tab.
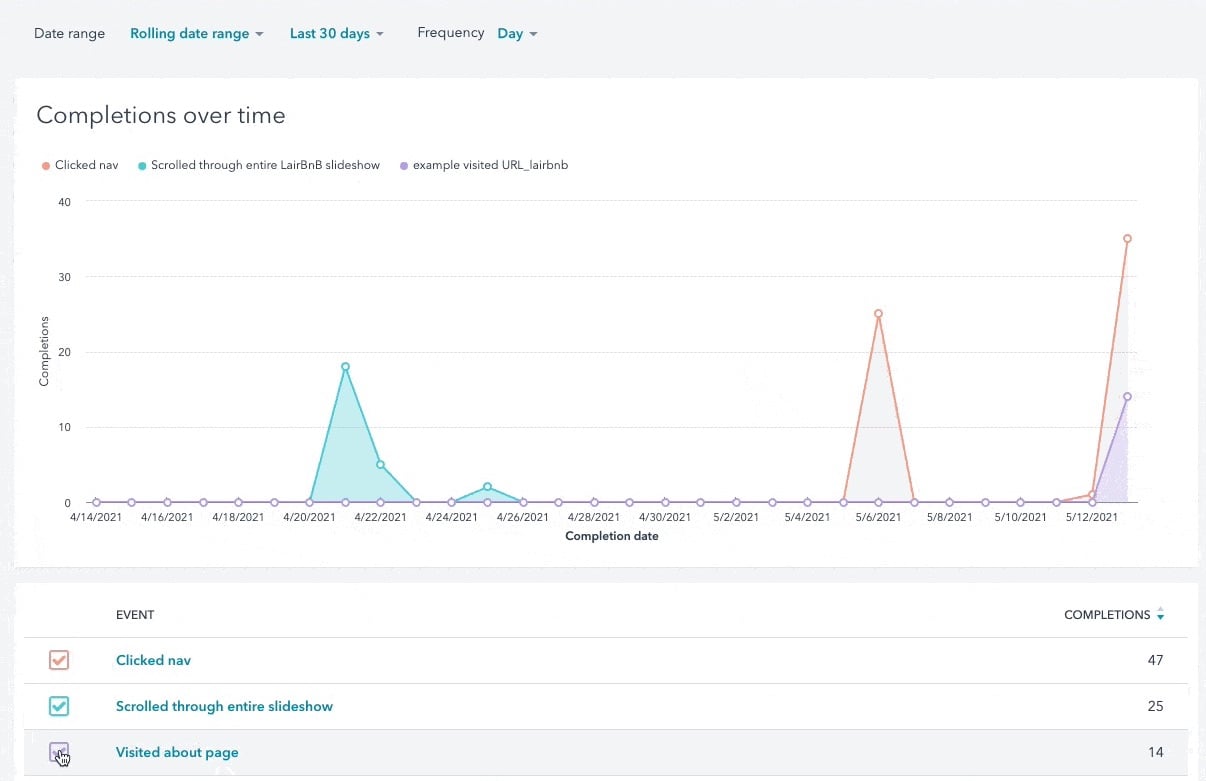
5. To view the completions, unique visitors, and the properties associated with a specific event, click the name of the event in the table below the chart.
How to Improve Event Tracking
To increase event completions on your site, identify problematic pages and then investigate and remove any barriers that are preventing visitors from clicking on links and other elements or completing other custom events.
Are your visitors engaged?
Building a website is a challenge — getting people to your website is an even bigger one. After completing all of that work, you’ll want to see something come out of it, namely conversions and sales.
Website engagement metrics will tell you how well you’re accomplishing this next step. These analytics are simple and actionable, pointing you to where engagement issues might be so, you can address them.
Simply put, a web strategy isn’t much without engagement metrics. So, if you haven’t started crunching the numbers, now’s the time.
Editor's note: This post was originally published in May 2021 and has been updated for comprehensiveness.